Graph Options
Most of the Seizure Tracker graphs have multiple time frame options (ie. day, week or month). Along with these graphs the reports on SeizureTracker.com offer a concise listing of seizure events, medication dosages, daily notes, and much more.
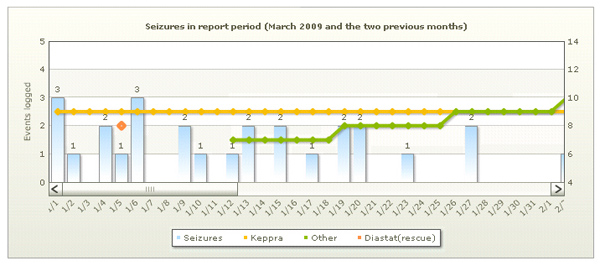
Seizure count and medication dosage graphs include:
- Daily, Weekly and Monthly increments
- Event count
- Medication dosages
- Rescue medication indicator (only available on the "By Day" graph)
- VNS device settings
- Diet therapy
- Daily variables (including missed medications)
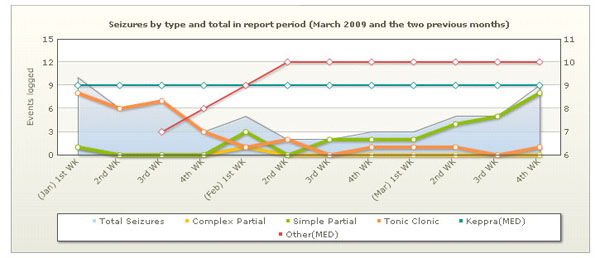
Seizure count by type and medication dosage graphs include:
- Weekly and Monthly increments
- Event count
- Medication dosages
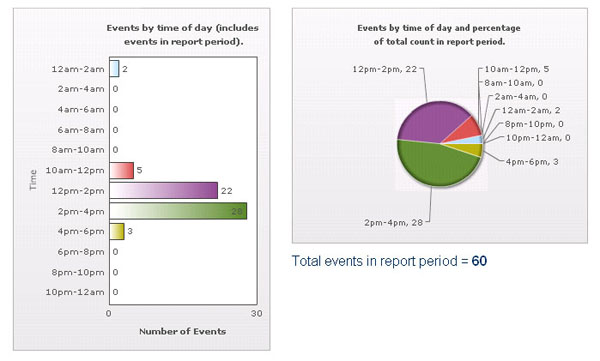
Seizure count by time of day graphs include:
- Bar graph representing time events occurred (two hour increments)
- Pie chart representing percentages by time of day
- Total event count in report period